Musings on microservice observability!
As software developers, we are constantly challenged and are expected to stay on top of the performance and monitoring of our applications and infrastructure. With microservice-based architectures, it becomes even more important to track metrics, identify bottlenecks, configure SLA’s and thresholds consistently across the stack and alerting. Based on research data available over public resources we know that a large percentage of developers running microservices at scale or planning to are running into similar challenges.
There are a number of enterprise and open-source tools available that do a great job for application and infrastructure monitoring. Also, it is quite common for teams to use a number of these tools and technologies across the technology stack. Guess what? This mostly results in metrics, event logs, and traces across distributed systems where correlation becomes a manual and therefore time-consuming exercise. Additionally, the process is often error-prone due to differences in the frequency of data collection, units, etc. Overall this may neither be effective nor optimized to pinpoint critical issues in the cloud-native and microservices ecosystem.
Three Pillars of Observability
Observability is key, with metrics, tracing, and logs being the three main areas of focus.
At Houghton Mifflin Harcourt we love Spring Boot and Node.JS and develop a lot of microservices that power the K-12 education technology (edTech) services!
Starting Spring Boot 2, a big area of focus was production-ready features such as the Actuator. For Metrics, Micrometer is now the default Metrics Collector that does a great job at gathering dimensional metrics with counters, gauges, histograms, etc. and provides a set of management configuration driven attributes to export to a variety of integrations such as Datadog, Prometheus and a dozen others. If you were looking to get started on this you could find a quick-start published here spring-boot-micrometer-datadog-quickstart
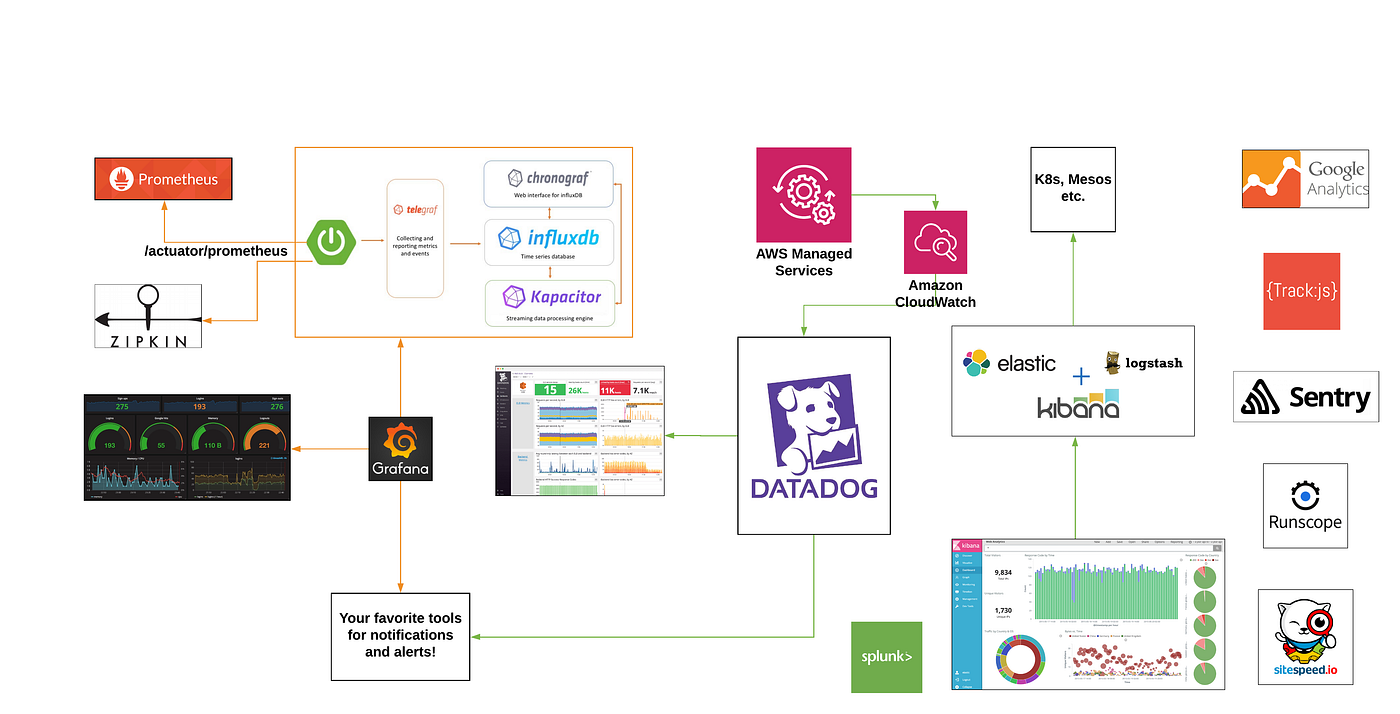
Opensource frameworks such as Prometheus, TICK stack and visualization on Grafana are often used together for unifying metrics across microservices. They only really solve one of the 3 pillars of observability — metrics.

Traces and logs still have to be correlated/scraped from other tools. As far as Spring Framework goes, you have Spring cloud Sleuth and integration with Zipkin (openTracing) and Brave for a tracing solution. While this works like a charm with spring boot and the java stack, the larger question remains about metrics and tracing on services built on other languages such as Node.js/Go/Ruby/Python/.NET or even Serverless deployments?
AWS X-Ray based distributed tracing could provide traces and service maps for Serverless deployments for your microservices or even your Lambda functions. Thinking of AWS Appsync as a use-case here where a graph query may result in a bunch of Lambda based resolvers and it becomes critical for a developer to get traces to measure and improve!
AWS Cloudwatch combines metrics from AWS Services and log groups. This is a great combination with API’s exposed for tools to extract metrics from. In addition, one may write Lambda Functions to forward cloudwatch logs for correlations. A microservices developer's dream would be to inspect slow query logs from your relational databases such as AWS RDS, alongside metrics for troubleshooting why an API may be slow? Good news! AWS RDS enabled log shipping to cloudwatch which could then be forwarded along to a centralized tool for correlation alongside metrics. We could use a Lambda based Datadog forwarder for cloudwatch log groups. Another project that could help consolidate metrics is Telegraf from the TICK stack which uses a plugin architecture with rich support for a number of integrations such as Cloudwatch, InfluxDB, Datadog, Prometheus, etc.
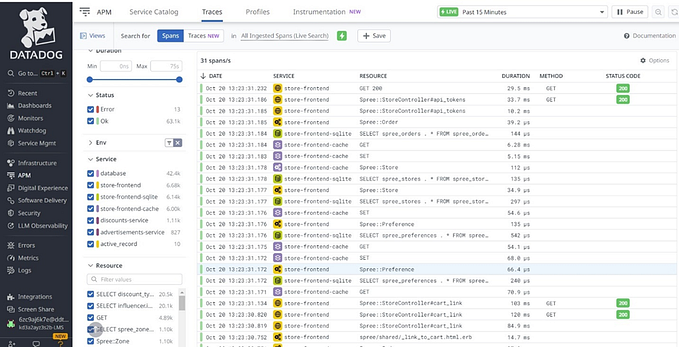
At Houghton Mifflin Harcourt the magic mantra has been to evolve into a single solution (Datadog) that can provide insights into the entire software ecosystem, regardless of where the telemetry data originated from. Rich set of features such as APM, Synthetics, Logs/Metrics/Event Aggregations, Tracing, Real User-Monitoring, Alerting, Cloud Integrations, and more made Datadog an obvious choice for us!

Enter OpenTelemetry
Something very exciting coming up is OpenTelemetry, from the Cloud Native Computing Foundation (CNCF), which is the result of a merger between the OpenTracing and OpenCensus projects to standardize how the industry uses metrics, traces, and logs. An excerpt from Wikipedia reads “A complete telemetry system [that is] suitable for monitoring microservices and other types of modern, distributed systems — and [is] compatible with most major OSS and commercial backends.”
Conclusion
OpenTelemetry holds the key and is potentially a game-changer. By integrating tracing and metrics and eventually logging into a single system, OpenTelemetry provides rich correlations between tracing and metrics and help developers effectively conduct root cause analysis in distributed systems. It also provides a vendor-neutral SDK across a variety of languages which also introduces uniformity and standards in this space. Standardizing data collection patterns and decoupling them from tools that consume them is a great step towards getting both OSS and Commercial tools to adapt to OpenTelemetry. The good news is that there is a lot of work already in this space! Checkout the OpenTelemetry projects on GitHub and also the Beta Releases that came out recently!
It is great to see Datadog already partnering with OpenTelemetry and reinforces our choice at Houghton Mifflin Harcourt to consolidate metrics, logs, and traces over Datadog!
Thanks to Darragh Grace, Kenny Wang, Anne-Marie McCullagh, and Craig Hunter for their review and feedback on the draft!