Dive into Kubernetes Healthchecks (part 1)
This is the first part of the series that will introduce you to K8s (Kubernetes) health checks and help you deal with the two main concerns when deploying your application:
- understand how K8s validates the state of your app and how to troubleshoot common issues
- consciously configure the deployment manifest and your application to efficiently report to K8s on its state
Note: I will be using the terms app, application, and service interchangeably. They all refer to a microservice that is part of a single K8s deployment.
Why do we need health checks?
Before we look into how K8s handles health checking, let’s discuss how our deployments would work without them.
Running into deployment and post-deployment issues
How often did you run into situations when after a seemingly successful deployment, you found that your application isn’t accessible or is being rolled back to the previous version?
So you try to access the application, but you notice some variation of a 504 gateway error. The next step is to go to check your CI but all you find there are green indicators. Then you verify the pipeline logs to take a look at Helm deployment output but the report informs on a successful deployment. If the deployment was successful, why there is a problem?

Then you resort to kubectl or the observability service that captures K8s events and you see that the app indeed failed post-deployment. K8s created a deployment as per Helm’s instructions, but for one reason or another pods with your application aren’t working.
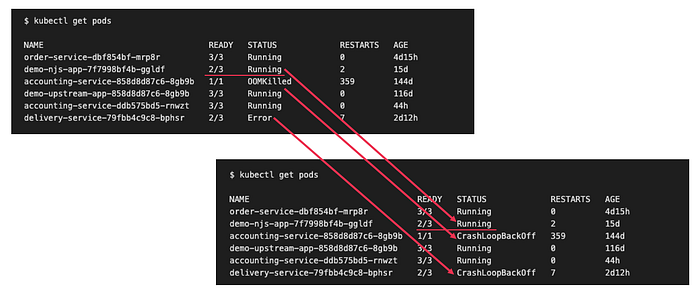
On the screenshot above we can observe multiple issues caused by multiple root causes:
- the first failing pod is running but it isn’t fully ready as READY=“2/3” indicates that one of the containers in that pod is not reporting that it is ready
- the second failing pod has been OOM killed
- the last pod could have failed due to some other issue such as not being able to pull the image from the registry
By this time, you may be asking some very important questions concerning your deployment:
- how can I find out what actually happened to my deployment
- what reconciliation mechanisms can K8s use to help my application recover
- how can I influence K8s remediation behaviour
Challenges of distributed systems
This is the containers map view in the observability service showing pods in the production K8s cluster. Application deployments are the part of a distributed system that involves our — the developers’ — special attention.

So what are the main challenges of distributed systems and microservices architecture? The list would include:
- automatically detecting unhealthy applications
- rerouting requests to other available replicas
- restoring broken components
Health checks have been created to help deal with this challenge.
Being (not) healthy and being (not) ready
To use the analogy of a car engine, there are two scenarios that might prevent someone from driving the car at full speed. In the first scenario, engine sensors report a failure, which will likely force us to look under the hood and think of ways to fix it. In the other scenario, we are to start the engine and move the car, but if the engine is still cold, it won’t provide us with maximum performance until it warms up. In this case, it is good practice to give it a bit of time before pushing hard on the gas pedal and testing the speed limits.

In the same way, our application might get a failure and become unhealthy. It may have started fine, but a bit later it broke, and the only way to fix it is to restart it. And if this keeps repeating, we need to look under the hood to investigate, similarly like with our car.
In the second scenario, the application has just started and appears to be healthy, but it is still cold and needs some time to warm up by doing activities like loading the framework context, establishing connections and so on.
Healthchecks in container orchestrator systems
K8s is not the only orchestration system that supports health checks, in fact, this is such a critical feature that it is used by every system orchestrating containers, as well as virtual and physical machines. Certainly, K8s has brought health checking to the next level compared to its predecessor.
At HMH, before moving to K8s, we utilized Apache Aurora with Apache Mesos for running our microservice deployments. The health checking mechanism implemented in Aurora aimed to validate application health by checking its liveness and this was configured by providing the following details:
- Application endpoint that should be checked
- The expected response from the endpoint
- The number of times the check needs to fail to deem the service unhealthy

This solution was enough to deal with scenarios in which a service becomes unresponsive as with this configuration it would get restarted, but over time we have run into many other issues where this type of health check was too limiting.
Default health checks in K8s
Let’s assume that we created a deployment with multiple pods where each of them contains three containers, one main container with our app and two additional side containers. Let’s also assume that we didn’t configure anything for health checking. How will K8s check the state of our app then?

Before we look into it, it is important to note that it is the responsibility of the kubelet to monitor the state of containers in each pod. For those unfamiliar, the kubelet is the primary “node agent” that runs on each node and is responsible for starting up and looking after containers and pods among other responsibilities.
As soon as the pod is scheduled to a node, the kubelet on that node will run its containers and, from then on, keep them running for as long as that pod exists. In the unfortunate event when the container’s main process (PID 1) crashes for any reason, the kubelet will restart the container (actually the entire pod).
But sometimes applications can stop working without their process crashing, for example, a Java app experiencing a memory leak will start throwing OOM errors, but the JVM process will keep running. Another example is where a process that is running our API can be in “deadlock” and may be unable to serve requests, but from the kubelet perspective, it all seems fine.
To summarise, when we rely on the default basic health checking our application might be not healthy but K8s won’t know about it and therefore won’t remediate it (restart) while the users will keep getting errors at the same time.
Application warm-up
By default K8s (actually the kubelet) simply observes the pod’s lifecycle and only begins to route traffic to the pod when the containers are up, which is when they move from the Pending to Succeeded state.
But we know already that the fact that the main process with our application has started doesn’t necessarily mean that the application is ready.
What are the things that may prevent a typical app from being ready?

When the application is starting, it might need to complete some of the following actions:
- Load application context
- Read credentials and configs from remote locations like the secret manager and the parameter store
- Create database connections
- Create connections to messaging systems
- Load data before running the application logic, run migration scripts
Here is another scenario, the app may have already started, it was ready and alive but then run into an issue when sending requests to any of its dependencies like a database or an upstream API.
To summarise, the problem is that the instance isn’t ready to take traffic but K8s doesn’t know about it. Requests from the users are sent to our application instances, but they receive server-side errors or timeouts.
Healthchecks in Kubernetes
Now that we have a better idea of why we need health checks, let's look at what they are and how can they be configured.
Three ways to check the health
K8s has three ways of running health checks:
1. Running a command inside a container
...
  exec:
    command:
      - cat
- /tmp/healthy- The kubelet executes an arbitrary command inside the container and checks the command’s exit status code
- It could be something like checking the presence of the file
$ cat /tmp/healthy
2. Opening a TCP socket against a container
...
  tcpSocket:
port: 5432- The kubelet opens a TCP connection to the specified port of the container, handy for non-HTTP cases like when hosting a DB
3. Making an HTTP request against a container
...
  httpGet:
    path: /healthz
    port: 8080
    httpHeaders:
    - name: Custom-Header
value: imJustAProbeRequest- The kubelet performs an HTTP GET request on the container’s specified port and path, we can even make the kubelet send requests with custom headers
- Status codes that are not between 200 and 399 are considered a failure
Three types of health checks
The mechanism that will be checking the health state of our app is called a probe in K8s jargon.

When set up, the kubelet will probe the designated application endpoints to find out how our app is doing.
Each of those probes will be configured to check a separate dedicated endpoint in our app.
Let’s compare what those three types of probes do:
1. Liveness probe
Checks whether the app is healthy. Not concerned only with whether the process is running but whether the app is functioning properly.
If OK: then keeps probing
If NOT OK: restarts the pod
The assumption here is that when the app reports a liveness failure, it means that it is not able to fix the root cause by itself. The only effective fix is for the kubelet to restart the entire pod with the presumption that after restart the problem will go away.
A failure reported by the liveness probe looks like below in the output of K8s events $ kubectl get events

2. Readiness probe
Checks whether the app is able to receive requests from clients. The readiness probe validates whether the app is ready after the launch or whether it has become temporarily unavailable.
If OK: continues sending traffic from clients and keeps probing
If NOT OK: stops sending traffic and keeps probing to find out when the app is ready again
The assumption here is that the app is aware of the issue and is able to solve it on its own. By reporting a failure, it asks to stop routing traffic from clients or the users as they will receive error anyway and the users will likely start retrying which may lead to generating larger volumes of requests that need to be processed which will definitely not help in solving the problem. As soon as the problem is resolved and the application reports readiness again, the traffic will be resumed.
A failure reported by the readiness probe looks like the below:

3. Startup probe
This probe has been added more recently to version 1.16 of K8s back in October 2019.
Checks whether the app started and is ready to be checked with the two other probes. It is usually used for apps that are starting slowly or have an unpredictable initialization process.
If OK: begins checking readiness and liveness
If NOT OK: restarts the pod
A failure reported by the startup probe:

The kubelet’s role in probing
The kubelet is responsible for checking the status of each container in a pod and if configured, sending probe requests to the specified endpoints. Depending on the outcome of that check, it will take the appropriate remediating action.
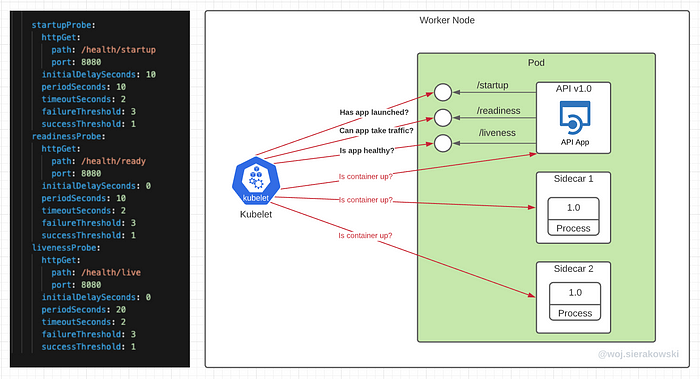
The above illustration depicts the deployment with pods that run tree containers, the main container running our app and the two other containers are sidecars supporting the main one.
Let’s assume that the manifest file configuration for probes is set only for the main container and two other containers don’t have any probes configured. In this case, the kubelet will check those two sidecar containers by executing the default check which is to make sure that the main process in those containers is running. This is enough as those two sidecars aren’t HTTP APIs, they could be a single process like Envoy or some adapter tool and all we care about is that this process is up.
The kubelet will also run the same basic check for our main container by default but in addition to this, the probe requests will be sent to the health endpoints defined in the configuration file.
Liveness probe in action
To better understand how the kubelet operates probes let's analyze the liveness probe failure scenario.
We have the following liveness probe configured for our main container. Let’s go through it line by line (by the way, those configuration values are for illustration only and we will discuss the decision process for finding the right settings for your use case in the second part of this series).

We choose that this probe will send HTTP requests to the /health/live endpoint on port 8080. Note that it is common to have application business APIs exposed on one port (e.g. 8080) and health endpoints /actuator/health on the management port (e.g. 8081).
Next, we specify the initialDelaySeconds which tells the kubelet how long it should wait before it sends the first probe requests. It is rare for an HTTP API service to be able to respond to HTTP requests immediately, thus this setting allows some time to let the application get to the state where it can actually respond to requests. This means that the kubelet will send the first request 30 seconds after it starts the container and the main process in that container is up.
- periodSeconds defines how often the probe request should be sent to the
/health/liveendpoint in our application. In this case, we want the request to be sent every 20 seconds. - timeoutSeconds tells the kubelet how long it should wait for the response from the application endpoint. In this case, not receiving the response within 2 seconds is considered a failure.
- failureThreshold tells the kubelet how many failed attempts must occur before the container is marked as unhealthy.
- successThreshold defines how many times the endpoint needs to respond with success response after previously failing to call the alarm off. For liveness and startup probes this value must be set to 1.
So let’s walk through how the kubelet will deal with the liveness probe failure based on the configuration above.
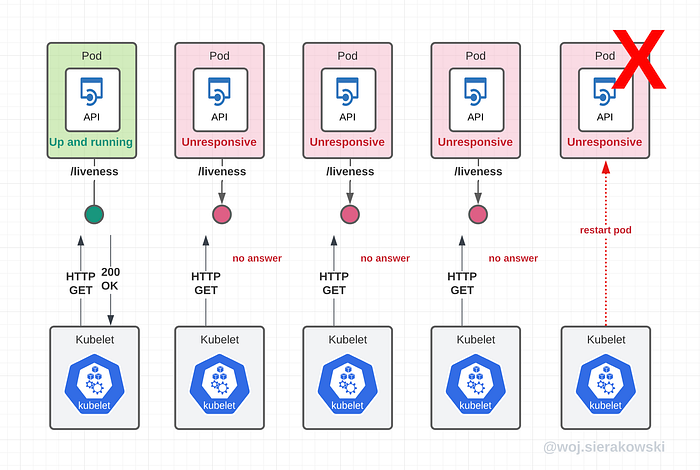
Every 20 seconds the kubelet will send a new probe request. In the scenario above, after the initial successful response, the following one is a failure. Then the next two also fail. Since the failure threshold was set to 3, after the third attempt the pod will be restarted.
Note that we define probes per container and not for the entire pod, but if a container fails, the entire pod will be taken care of.
Readiness probe in action
The readiness probe in our example configuration uses the same properties as the liveness probe.

In this case, we tell the kubelet to send the requests to /health/ready endpoint. We also tell it to wait 30 seconds before sending the first request, send requests every 10 seconds, and wait no longer than 2 seconds for the response. We also want the check to fail 3 times before taking remediation action and only one success response after failure to assume everything is ok again.
Let’s walk through the scenario when the application is launching and the kubelet checking when it is a good time to start routing traffic from clients.
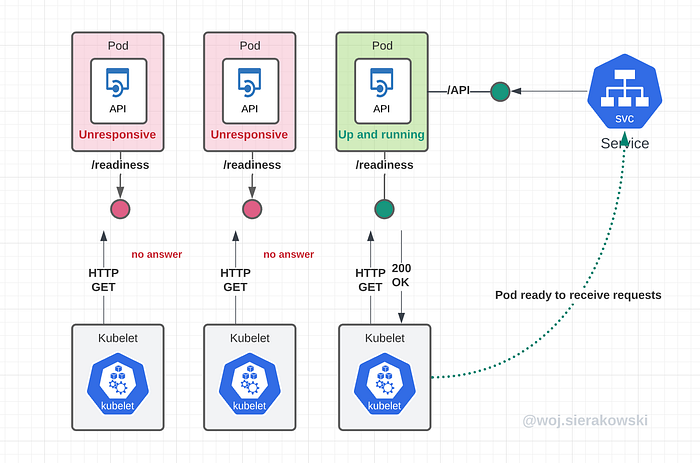
The kubelet sends probe requests every 10 seconds. The first two requests come back with errors but the third one is successful. Since the success threshold was set to 1, the kubelet enables K8s service to route traffic to the pod.
Demo: Probing HTTP endpoints
It’s time to see the kubelet probing in action — from the application’s perspective.
For the purpose of this demo, you can use your own application or otherwise you can deploy the Node.js based demo app called demo-njs-app that I quickly have put together and shared here: https://github.com/wsierakowski/demo-njs-app (you can ignore all the AWS related stuff there which was added for another article). The docker image with the app has been published to the public registry here: https://hub.docker.com/r/wsierakowski/demo-njs-app. You can refer to it directly from the deployment file as I did below but the general advice is to never trust images from unknown sources!
Let’s deploy the app with a deployment file that contains the following probe configurations:
We enabled all three probes, the startup will be invoked 10 seconds after the container starts, readiness and liveness will begin immediately after startup ends and readiness will probe every 10 seconds while liveness every 20 seconds.
Let’s also enable the app to log every request to the /health/ready and /health/live endpoints.
The demo app by default has the logging on probes switched off, so right after deployment, you can enable it by hitting this URL debug/health/probelogging/1 with the POST request. This can be done in a number of ways, depending on your configuration, like sending a request to the service through the ingress, port forwarding or exec’ing in the container providing the image contains curl utility.
$ curl -X POST localhost:8080/debug/health/probelogging/1
{"probeLogging": "true"}
Once the application is deployed and you can find out the pod name with kubectl get pods, you can inspect the main container logs with the following command.
$ kubectl logs <pod-name> -c <main-container-name> --followYou should see a log similar to the one below. We can see that the first probe requests came to /health/startup, then to /health/live and /health/ready around the same time but the readiness endpoint was then called twice as often. Exactly as we expected after we set our configuration.
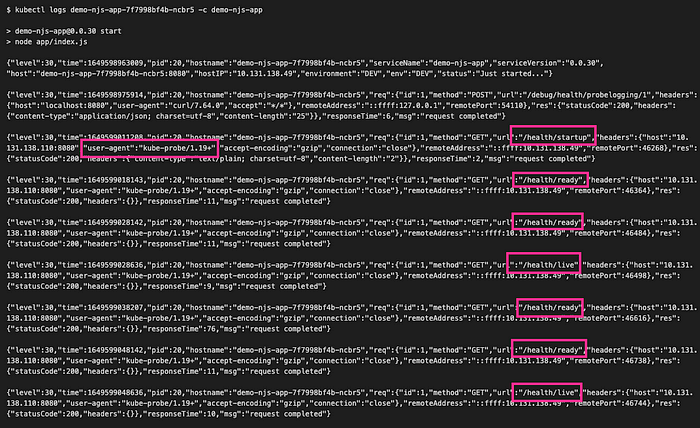
What we can also see is that the user-agent is set to kube-probe with the version of K8s cluster.
Probes flow diagram
In the diagram below we can review interactions between the three types of probes and their reactions to failures. We can see that if the startup probe is enabled, then the kubelet will start sending the startup check, if it fails, the pod will be stopped, otherwise, it will wait until the first successful response but no longer than we specified in the failureThreshold. Once successful, it will execute readiness and liveness probes (if they are both configured) and follow a similar logic, with the distinction that failing liveness stops the pod while failing readiness stops the traffic to the pod.

Probes and pod startup
Let’s have a look again at what exactly happens when we configure all three probes and start a new pod.

Initially, when the pod and its containers are just starting, the kubelet will check if the process is up and running. If this pod has only one container in it, we should see the READY status set to 0/1 in kubectl get podsoutput.
Once the main process in the container is up, the kubelet will wait for initialDelaySeconds before sending the first request to the startup endpoint. At this stage, the READY status still shows 0/1. Until the startup endpoint responds with a positive value, K8s assumes the app is still starting.
Then, the startup endpoint responds with success, the kubelet marks the container as “the app started” and then goes to execute both readiness and liveness probes as soon as their initialDelaySeconds passes (if it was set). At this stage, we still see READY 0/1.
Finally, the liveness probe responds with success as the app reports that it is up and fine, but it might be still setting up connections to some of the dependencies so the readiness might not be successful right away. But at some stage, it will, so then it will report its readiness to the kubelet which in turn will let the client traffic coming into the app. At this stage, we will see READY 1/1.
The kubelet will continue to watch the process to make sure it is still running and if it finds that it exited with a non-error or error exit code it will take the necessary actions depending on the configuration in our deployment resource manifest.
Demo: Liveness check failure
Now let’s have a look at the liveness check failure leading to a pod restart.
We are going to use that same deployment configuration file with the same probe settings as before. If you use the demo Node.js app from before, we will deploy it and let it start and then after some time flip the switch to make it respond with the error status to the liveness check request.
First, let's open two terminal tabs to watch the changing pods with kubectl get pods -w and events with kubectl get events -w.
The demo app will set the liveness check to fail if we send a post request to the following endpoint:
$ curl -X POST localhost:8080/debug/health/live/0
{"LIVE_ON": "false"}
If we now send a request to /health/live endpoint, we will get the following the 5xx response, this is the exact same response that the kubelet will receive as well.
$ curl localhost:8080/health/live
{"status":"DOWN","checks":[{"name":"liveCheck","state":"DOWN","data":{"reason":"Manually triggered fail"}}]}
If we look at the events we should see that the kubelet received three unsuccessful liveness checks and then, as per the configuration, it marked the pod for restart:

Then if we look at the pods' view we will see that the pod with the liveness endpoint failing has been restarted:

Meet CrashLoopBackOff
If the app continues failing the liveness checks, even after the pod restarts, we will notice the CrashLoopBackOff status reported.
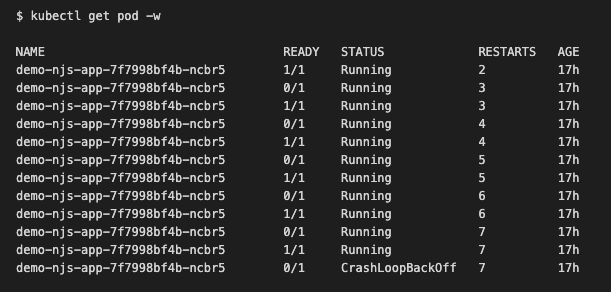
The screenshot above presents a case where a pod is repeatedly failing and the number of restarts increases — this is a view when we runkubectl get pods -w where -w allows us to watch changes over time.
CrashLoopBackOff is a state in which the kubelet will attempt to restart the pod after a failure but it will wait a bit more time with every next unsuccessful attempt. For example, if our pod fails, it will be first restarted immediately, if it fails to start again, it will be restarted after some delay, then if it fails again, it will be restarted after a longer delay and so on.
Failing liveness checks is one of the reasons for CrashLoopBackOff if the parameters aren’t set correctly for your app, for example, your web app takes longer to start than initialDelaySeconds + failureThreshold * periodSeconds set on the startup/liveness probe.
The list of other common root causes for seeing CrashLoopBackOff includes cases when the following symptoms occur repeatedly:
- the app finishes execution with a non-zero exit code
- the app running out of memory and OOM kill
- the kubelet not being able to pull the requested image from the registry
When one of the pods of your deployment is in this state, you will notice that the deployment status shows that it is not ready (with 0 deployments available) and the replica set is not ready either.

Demo: Readiness check failure
We’ve seen a demo of what happens when the liveness check fails, now let’s see how the system behaves when the readiness check fails.
Let’s do a deployment with one replica initially. You can again use the demo Node.js app. You can make the application fail the readiness check at any time by switching the readiness responses off with this POST request:
$ curl -X POST localhost:8080/debug/health/ready/0{"READY_ON": "false"}
When you now send a request to the readiness endpoint you should see the following response, which is also what the kubelet will see:
$ curl localhost:8080/health/ready{"status":"DOWN","checks":[{"name":"readyCheck","state":"DOWN","data":{"reason":"Manually triggered fail"}}]}
If we now check the kubectl get events -w we should see readiness probe failures:

After three failures, as instructed, the Kubelet will react, but this time instead of restarting the pod, it will stop the traffic to this pod. Restarting that pod would not solve the problem which is most likely caused by not being able to establish connections to one or more dependencies.
If we try to reach the application through the endpoint exposed by the ingress, we will see an error indicating there’s no active destination for our deployment since we have only one pod and it isn’t ready:
$ curl -v https://dev.your-domain.com/ns/demo-njs-app
...< HTTP/2 503
no healthy upstream
If we check kubectl get pods we should notice that the pod is up but not ready:

The kubelet hasn’t stopped probing the service. It assumes that the app is able to resolve its issue by itself, depending on what is the reason why the app decided to report that it isn’t ready. As soon as the app reports readiness again, the traffic from the clients to this pod will resume.
Now let’s switch the app to respond successfully to readiness probe requests. Remember that the request is not going to get through to the pod via the ingress as the K8s service will not route any traffic to the pod that isn’t ready, hence you need to either do this through port forwarding or exec:
$ kubectl exec demo-njs-app-7f7998bf4b-ncbr5 -c demo-njs-app -- curl -X POST localhost:8080/debug/health/ready/1{"READY_ON": "true"}
As per the configuration, as soon as the next probe request receives a successful response, the traffic to that pod is going to be resumed again. If we try to send the request to the app through the ingress, we should see the expected response:
curl -s https://ingress.mydomain.com/apis/demo-njs-app/info{"info":{"serviceName":"demo-njs-app","serviceVersion":"0.0.30","host":"demo-njs-app-7f7998bf4b-ncbr5:8080","hostIP":"10.131.140.250","environment":"DEV"},"message":"Received request from \"::ffff:127.0.0.1 + \".\""}
Consequences of not having startup/readiness probe set up
Let’s review a scenario where we haven’t set up either the startup or the readiness probe. This scenario applies to the case when we perform the new version rollouts, we (or HPA) scale pods out, the cluster scales in worker nodes and performs rebalancing or a pod failed and needs to be restarted.
To make things easy, let’s assume we had a single replica deployment. The pod is running fine but we decided to add another replica to the existing deployment.
When the second pod is started, when the kubelet sees that the main process in the container is up, it will allow the traffic to come through. But the fact that the process is up doesn’t mean that our application is up. It still needs to read configuration data, read secrets and credentials, initialize the context, load all the dependencies, establish connections to databases, fetch some initial data and so on. Before that happens it won’t be able to respond with anything meaningful to the user. But the traffic is coming, assuming it will be equally split between the two pods, half of the time clients will be receiving errors. This will continue until the app warms up and finally starts processing incoming requests.

If that same deployment with one replica initially was configured with the startup or readiness probe, the kubelet would not allow the traffic from the clients to come through to the new pod. When the app in the new pod was still initializing, the requests would only be routed to the first pod until the app in the second pod reported readiness.

Demo: Readiness check failure in a deployment with multiple pods
Let’s demo a similar scenario. But this time we will have a deployment with two pods and one starts reporting readiness failure.
To do that, let’s modify our previous deployment manifest to create two replicas and make sure the startup and readiness probes are set up.
We should see both pods up and running:

We can also open another terminal tab and launch the following loop that will execute cURL to send a series of requests to the service and print the timestamp along with the server response which returns the hostname (that is the same as the name of the pod the app is running in):
for i in `seq 1 9999`; do echo "[$(date '+"%T"')] Response from: $(curl -s https://dev.your-domain.com/ns/demo-njs-app/info/hostname)"; doneWe should see that client requests are load balanced equally between our two pods:

Similarly to before, let’s now switch the readiness probe of one of the pods off:
$ kubectl exec -it demo-njs-app-7f7998bf4b-cjg97 -- curl -X POST localhost:8080/debug/health/ready/0{"READY_ON": false}
If we check the events, we should soon see the probe failing three times:

And if we check the pods, we should see one set as not ready:

When we take a look at our loop with curl, we should notice that responses are coming back from the pod that reports readiness only:

As soon as we go and switch the readiness in the excluded pod, we should see the requests coming into both pods fifty-fifty.
The below diagram illustrates the demo we just did:

Without the startup or readiness probe, the users would receive errors for as long as the other pod is not ready.
Probes and rollouts
There is another aspect where the way how probes are set up is important — the rollouts.
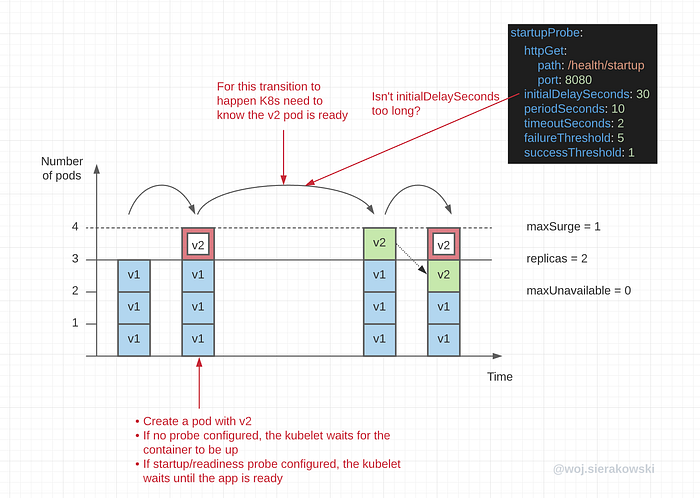
When we perform a rollout of a new version of the application with the RollingUpdate strategy a pod with the previous version (v1) of the app will be terminated as soon as K8s assumes the new pod with the newer version of the app (v2) is ready.
Without a probe, as we remember from previous paragraphs, the kubelet will only check whether the process is up and then it will immediately set the pod’s status to READY. But this might be done prematurely, the v2 pod isn’t ready to take traffic but v1 is already being terminated.
With the startup and/or readiness probe set, the kubelet will wait for the v2 pod to report readiness before the v1 pod is terminated.
But there are two caveats:
- If we wait too long to start startup and readiness probes (initialDelaySeconds), this will slow down the deployment — the kubelet will be waiting unnecessarily while the application might already be ready
- If we start probes too soon, a pod may get restarted (due to a failing startup probe) before the service is ready to start responding and this will delay the deployment or even cause the rollback
Inspecting probe errors
It’s important to recognize the type of probe failure as this will help in troubleshooting issues that are the root causes of those failures.
When we inspect K8s events with kubectl get events we might see one of the two reasons why the probe failed:
1. HTTP status code with error

This indicates that the application is up and the readiness fail is controlled. Something happened and the app wants some break to fix the issue or wait for the issue to be solved upstream.
2. TCP connection error

This indicates that the kubelet wasn’t actually able to establish a TCP connection, the application isn’t set up yet to receive HTTP requests and respond to them.
Developers’ responsibilities
By now we have a good understanding of the role of the three K8s probes, we know what happens if we have them disabled and enabled and how K8s relies on them to keep our deployment healthy.
With all that knowledge, the question you might be asking now is what is the developer’s responsibility in terms of configuring health checks correctly.
There are two areas we will need to focus on:
1. Configure K8s deployment to match your requirements

Our responsibility here is to configure the deployment manifest to run probes for correct endpoints and ports and with the values that correspond to our operational and business needs.
2. Configure the application’s framework to match your requirements

The responsibility here is to configure the application to correctly inform K8s through the health endpoints on its state. If it needs to be restarted, it should fail the startup or liveness check. If it temporarily can’t process requests from clients, it should fail the readiness check and let K8 know that it needs some time to recover.
There are default settings that many microservice frameworks provide, if you happen to use one, often there are some additional configuration options that a developer can utilize to control the health information passed to K8s to control K8s reconciliation logic in a more efficient way.
The official guide for configuring the pods is available here: https://kubernetes.io/docs/tasks/configure-pod-container/configure-liveness-readiness-startup-probes/
If you reached that far, I hope you have learnt a few new things. If you liked this article and would like to see more, share your feedback.
In the second part of this series, we will discuss various considerations developers should be aware of when configuring both the K8s deployment as well as the application framework for using the probes responsibly and efficiently.
I would like to thank Francislainy Campos and Kris Iyer for their review and feedback on this post.

