Dive into Kubernetes Healthchecks (part 2)
This is the second part of the series introducing you to K8s (Kubernetes) health checks. In the previous part, we got familiar with how K8s checks the health of our application, what are the three types of probes and what are the consequences of not setting up the probes. In this part, we will focus on considerations we should factor in when configuring the probes in our deployments and tweaking our application to report its state to get the desired response from K8s.
Note: I will be using the terms app, application, and service interchangeably in this article, they all refer to a microservice that is part of a single K8s deployment.
Setting the context
How the app should respond to K8s probes?
These days microservices rarely work in isolation. A modern microservice depends not only on the data sources with business data but also on infrastructure-related sources. Below is the view of a typical microservice and its dependencies.
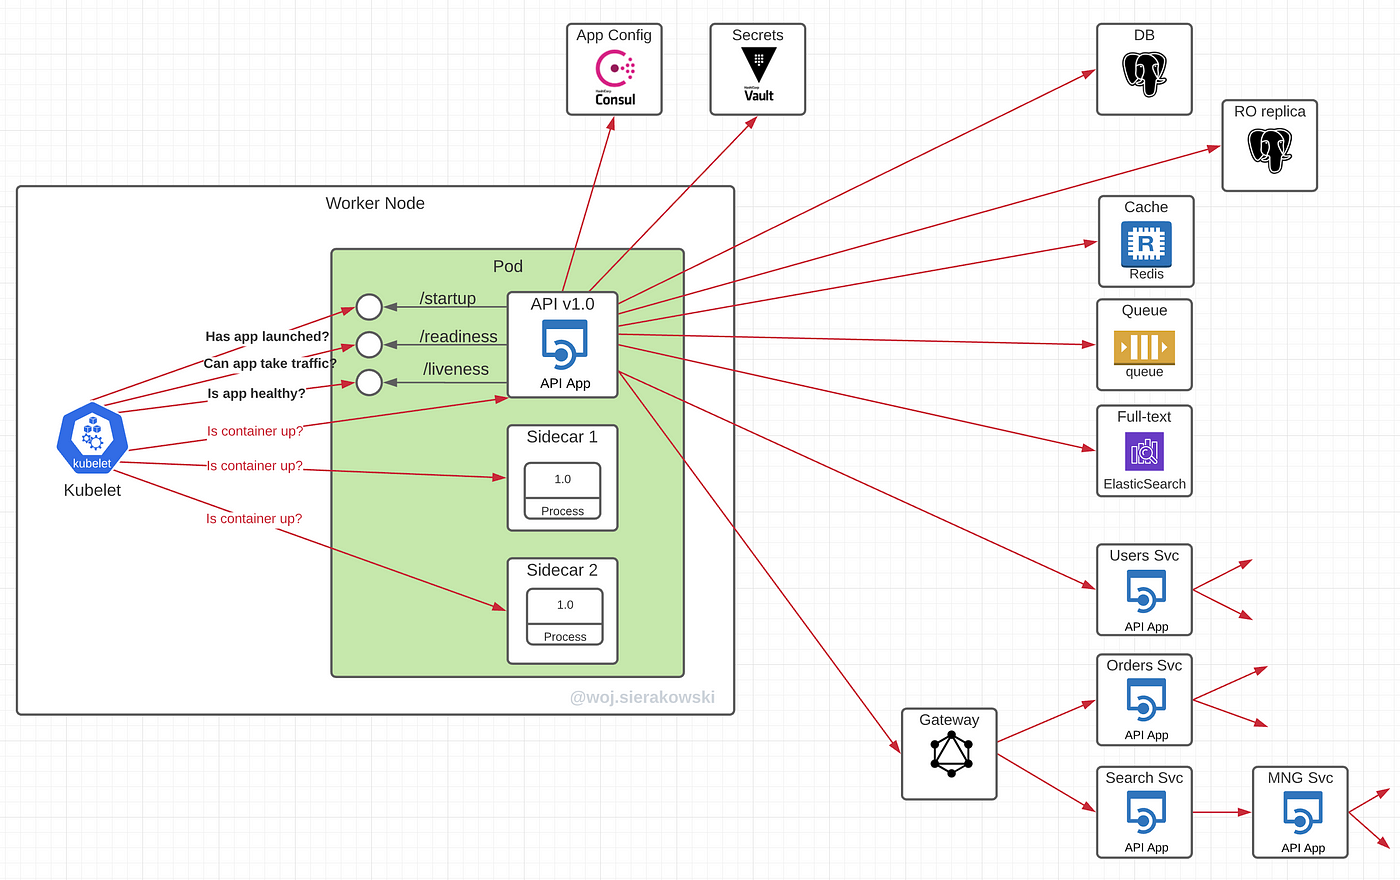
Microservices interact with databases, database replicas, caches, message brokers or queues, and other upstream microservices exposing their APIs. In addition to this, a service may also fetch tokens and credentials from a secret manager and load configuration data from a parameter store (see the application warm-up section in the previous article for more details).
Finally, our application is just a piece of the entire distributed system, the way how it reacts to its own challenges will have an impact on its own downstream dependencies.
With all this in mind, we want to ensure that we apply the best possible deployment configuration that will correctly respond to the startup, readiness, and liveness probes results. This means we need to know exactly when the app has started, when it is ready to take traffic, and whether it is alive and healthy.
The problem is that if the probes aren’t configured correctly and if the app isn’t reporting its state in the right way, this can severely degrade the operation of the entire system, even to a point when we would be better off without them at all.
Cascading failures
When planning the health check configuration, it is very important to always have the big picture in mind — just to repeat this again, our service is most of the time only a part of the entire ecosystem of services. In an ideal world, those services are decoupled from each other and communicate in asynchronous ways through message brokers and queues. But often this isn’t the case, there is a coupling between services and the communication is synchronous, which comes with consequences.
Consider the illustration below. A single service has a problem with database connectivity. How the service responds to this issue will have an impact on other services that depend on it.

If service A reacts by failing a liveness check, this will make the kubelet restart the failing pod. Will this help in restoring the problematic database connection? Here are some considerations to think about:
- Is this a single instance of a multi replica deployment for service A that has this problem or all instances?
- What consequences will this have on other services?
- Will this cause a cascading reboot if dependant services also start failing liveness checks not being able to communicate to a service A?
The liveness failure doesn’t seem to be a good solution to this scenario.
If service A responds to this situation with a failing readiness check, this will stop the traffic to that failing instance. Again, we have some considerations to review:
- Is this just one instance or all instances of service A that have issues with the DB connection?
- What will be the impact of the traffic completely cut off to service A and how will dependent services react to this
- If dependant services also report readiness failure to stop taking traffic from end-users, what consequences this will have on the user experience?
The readiness failure seems to be a better response to this scenario than the liveness failure. However, there are also cases where we would want the application to handle this issue without failing any type of probe. We will discuss this in more detail in the later sections of this article.
Smart probes and dumb probes
There are two approaches to designing the probes, or more specifically, the way how the application responds to the probes: dumb probes and smart probes.
Dumb probes indicate that the application is up and running. In the context of a microservice framework, this would be checking the basic stuff such as whether the context is fully loaded, that the app is up and serves on the desired port and is able to respond to the HTTP requests.
Smart probes go deeper than that by checking not only whether the app is running but that it is functioning correctly and that it can deliver its business purpose by interacting with its external dependencies like databases, brokers, queues, and other APIs.
The general advice is to use:
- smart startup probes
- dumb liveness probes
- smart readiness probes (usually)
Startup probe considerations
It is usually suggested to use smart probes for the startup check.
As a quick reminder, if the startup probe is configured in the deployment manifest, the kubelet will probe the specified endpoint until it gets the first successful response or until it reaches the failureThreshold value. Only after the startup check passes, the kubelet will go ahead and execute readiness and liveness probes.
The application's startup endpoint reports success when it loads all the necessary credentials and configuration and establishes connections with all required upstream dependencies.
Typically this would mean that the application will need to obtain security tokens, credentials, API keys and secrets from secret stores such as Vault, AWS Secret Manager or Azure Key Vault, and application configuration settings from parameter stores such as AWS Systems Manager Parameter Store or distributed key-value DBs like ConsulKV. After this, the application might check connections to business data sources like databases, queues, brokers, and caches and even fetch some initial data.
Many frameworks like Spring support only readiness and liveness endpoints and they don’t expose a separate startup endpoint. In this case, we can configure the startup probe to use the applications readiness endpoint but with different settings like a higher failureThreshold value to account for longer startup times. Startup and readiness endpoint implementations are often quite similar in terms of what internal checks are done by the framework to inform on success or failure.

Starting up without a probe
To fully appreciate what a startup probe brings, let's review the case where we don’t have it configured.
The scenario discussed below is applicable in the following cases:
- adding more instances to the existing replica set
- restarting a pod due to the previous failure, cluster downscaling, node failure, cluster maintenance
- new application version rollout
For simplification, let’s assume there is only one container per pod.
The new pod in the service deployment has been brought up, the container with the application is up, but the application needs some time to fully initialize.
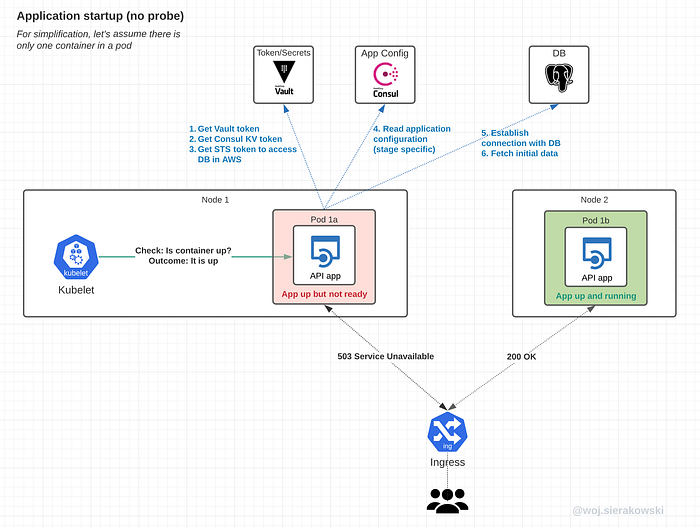
We can see the following issues when the startup probe isn’t configured:
- as soon as the container is up, traffic is routed to that instance, even though it isn’t ready yet
- if the app fails to start, it will be hanging there and the pod will not be restarted
Starting up with a probe
Let’s review that same scenario but with the startup probe configured.
Here we can see that no traffic is routed to the pod, even though the container and the main process in that container are already up.
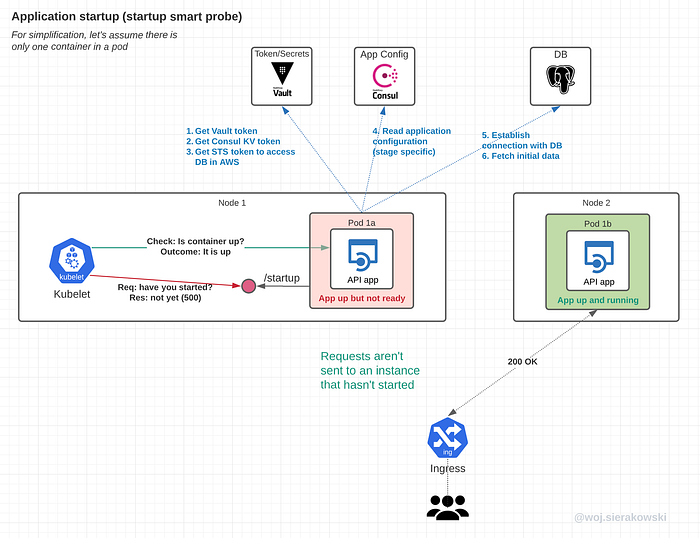
We configured the startup probe in our deployment and we configured the application to report success when:
- Security tokens and credentials are retrieved from the Security Manager
- Application configuration is retrieved from the Parameter Store
- DB connection is established
- Initial data is fetched from DB (if required)
Startup probe math
What are the recommended values for the startup probe to ensure fast and stable deployments?
Case: we have an app that must establish many upstream connections that are critical to the business functions of its APIs
Consideration: Depending on the conditions, the app may usually start fast, but we need to account for cases where it may start slow due to external factors and we don’t want to run into a case when the pod gets restarted due to slowness upstream.
If we test our application locally with mock dependencies that send responses back immediately and we find that the application is ready within 10 seconds, then this could be our initial initialDelaySeconds value. The local environment, which is in most cases our laptop, is usually much faster than the resource allocation on the production K8s cluster. Most likely your local machine has a multicore CPU and loads of RAM which allows the app to start blazingly fast but in most cases, we don’t need that many resources for the K8s deployment for the microservice’s runtime operation, hence the app’s start and warm-up will be usually slower.
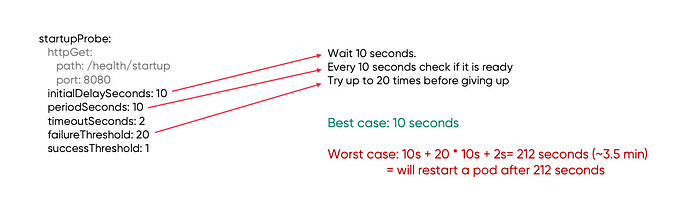
We can set periodSeconds to 10 seconds and failureThreshold to 20 to make the kubelet repeat the probe check for 200 seconds which is close to 3 and half minutes. Together with 10 seconds of the initial delay, this gives 212 seconds. This should be enough for the app to start and if it hasn’t, the kubelet will restart the pod.
Take a look at the visualisation of what the worst-case scenario for the slow-starting application may look like.
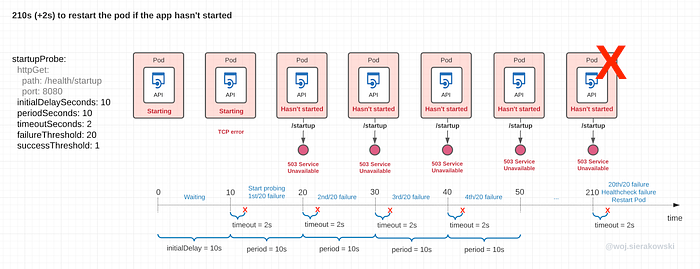
- 0–10s: the container has been spun up but the kubelet doesn't do anything waiting for the initalDelaySeconds to pass
- 10–20s: the first probe request is sent but no response is sent back, this is because the app hasn’t stood up the APIs yet, this is either a failure due to 2 seconds timeout or an immediate TCP connection error
- 20–30s: the app has got up but has only started fetching credentials, configurations and so on, so the response to the probe request is 5xx
- 30–210s: the kubelet has been probing but the success response didn’t come and is reaching the limit set by the failureThreshold. In this case, as per the deployment configuration for the startup probe, the pod will be restarted after roughly 212 seconds
Total time to restart the failing app: 10s + 20 * 10s + 2s timeout = 212 seconds (~3.5 min)
212 seconds for the app that locally starts with mocked dependencies might be a bit too long. This will slow down the speed of deployment and it might be better to reduce this period if we are completely sure that reading secrets, credentials and establishing connections with DBs and other data sources should never take that long.
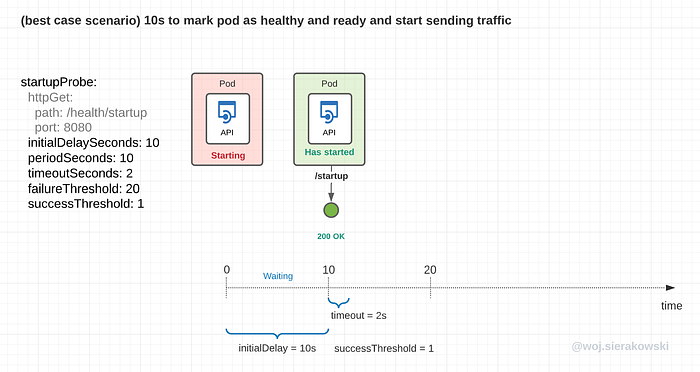
The visualization for the best-case scenario is very simple, the app will report success immediately after the first probe request:
Liveness probe considerations
It is usually suggested to use dumb probes for the liveness check.
With liveness probes we want the kubelet to know whether the application is alive, irrespectively to the connections it has with any dependencies. If the app reports errors on the liveness endpoint, the pod will be restarted.
The issues we want to detect with the liveness probe are memory leaks, thread leaks, deadlocks, connection pool issues, blocked event loops, generally anything that leads to being not able to handle HTTP requests.
Some considerations for configuring liveness checks:
- If you configured your app to check its state whenever a request from the kubelet to the
/livenessendpoint arrives, then make sure those checks don’t take long as this may cause the kubelet to restart the pod due to timeouts - When an uncaught error is captured, the app may end up in an unstable state; rather than letting the app run, it might be better to fail the liveness check or even better immediately exit with an error code — this will make the kubelet restart the pod immediately
- When setting the timeoutSeconds value, depending on the specifics of your application and the environment it runs in, consider things that are temporal in nature and may slow down liveness responses from your app. Those temporary conditions would include network congestion, garbage collector activities, load increase or upstream slowness.
App unresponsive without a probe
Let’s review the scenario where we don’t have the liveness probe configured and the application runs into some issues.
This scenario is applicable in the following cases:
- the application is up and running but it becomes unresponsive
- the application may be aware that it is unresponsive and can’t fix it on its own, so it is reporting a failure
Let’s assume that the readiness probe is also not configured.
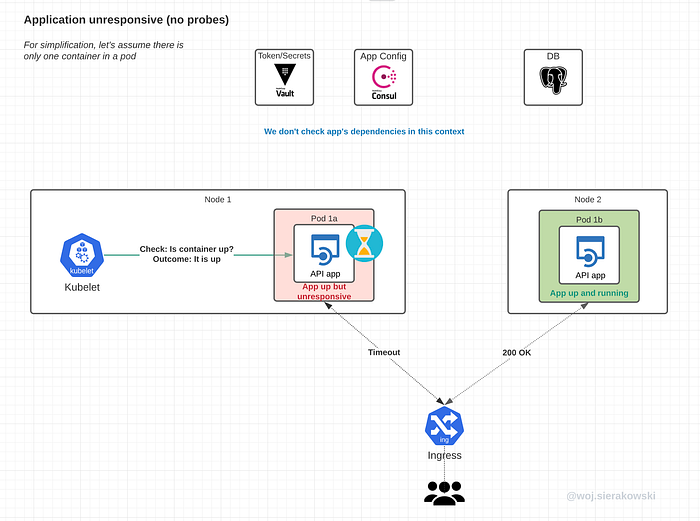
We can see that the application became unresponsive due to some internal issue but the kubelet is unaware of it as it only checks whether the main process in the container is up.
The issues this will lead to:
- some or all users will start experiencing high latency, timeouts or gateway errors
- K8s is unaware of this and will not take any action to remediate
App unresponsive with a probe
With the liveness probe configured, the kubelet will send the check request to the application's liveness endpoint. The application is configured to use a dumb probe, so it should be a quick response with 200 OK.
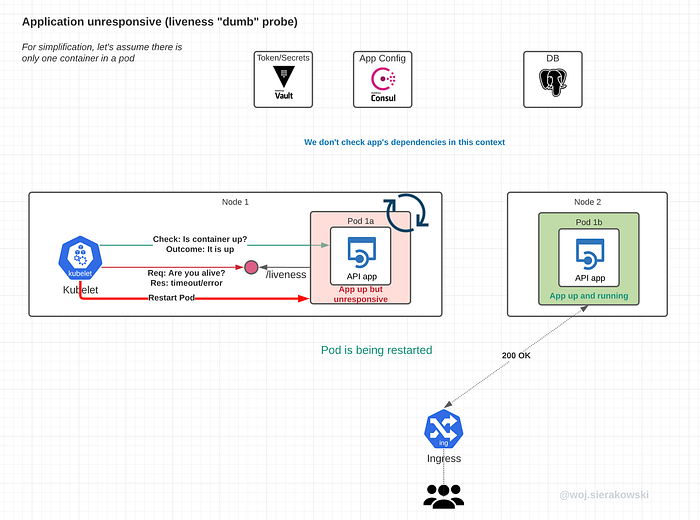
If the response doesn’t come back and times out or comes back with an error, the probe will fail and if this repeats for as long as the failureThreshold defines, the kubelet will restart the pod.
In the case when both the liveness and the readiness probes are configured, usually both probes will fail around the same time, hence the user traffic will be cut off by the failing readiness check and all traffic should be routed to remaining healthy instances of the app.
Liveness probe scenario on the timeline
Let’s review the scenario where the liveness probe plays a role in making the kubelet remediate an unhealthy deployment. The deployment configuration also has a startup probe configured. The application was started, it was healthy and responsive, but then something happened and it couldn’t recover on its own.
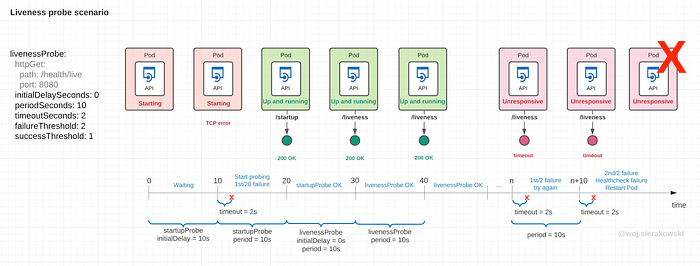
Let’s walk through each 10 seconds period:
- 0–10s: the container has been just spun up, the kubelet waits for the initialDelaySeconds set for the startup probe (10s) to pass before sending the first probe request
- 10–20s: the initial delay has passed, the kubelet sent the first startup probe but the response was an error as the app is still launching
- 20–30s: the application has launched so at the next startup probe it reports success, since the liveness probe initialDelaySeconds was set to 0, the liveness probe request is immediately sent and the app responds with a success status
- 30-ns: the application works without any problems until a certain time (n) when it hung. The liveness probe comes back with a failure for the first time
- n-(n+1)s: the liveness probe response is erroneous for the second time. Since the failureThreshold was set to 2, the kubelet restarts the pod
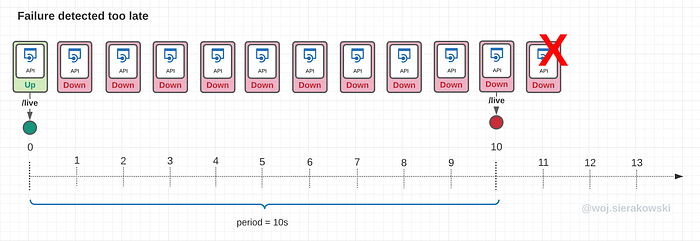
Finding the right balance for periodSeconds
When deciding on the value for periodSeconds in probe configuration we need to find a good balance:
- we want a short execution interval to ensure the highest availability
- but on the other hand, we don’t want to overload the app with too many probe requests
Overloading might or might not be a problem, this depends on how the framework our application uses checks for the status before it responds and on whether it is a dumb or smart probe (see the paragraph on active vs passive checks later in this article).
If the period is too long, there could be time periods where the application becomes temporarily unavailable, but this isn’t captured by the kubelet as the sampling rate is too low.
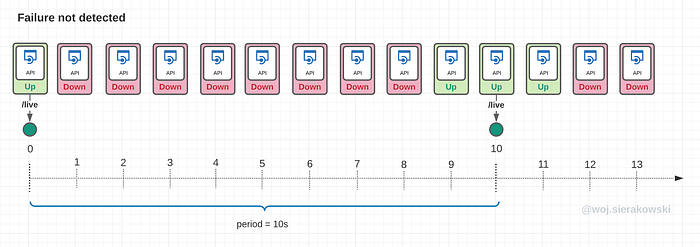
In the second scenario, the application failed right after successfully responding to the last liveness check. But the kubelet won’t know about this until it sends the next probe requests. For this whole time, the app is unresponsive and some users may experience this.
Readiness probe considerations
We already know that for liveness probes we would usually use dumb probes and for startup smart probes. Which probe approach we should use for the readiness probe?
The answer is… it depends, but most likely smart probes, or something in between.
If you ask around or search the internet, you will find many different opinions and experiences.
Here are some of the considerations:
1. Aggressive vs conservative approach to failing readiness probe
We should be aggressive in failing the readiness probe when we verify the dependencies exclusive to a single instance within a multi replica deployment. For example, this could be a private cache just for this instance only, other instances have their own caches.
We should be conservative in failing the readiness probe when we verify dependencies that are shared among multiple instances of the application deployment.
We want to avoid a scenario when all pods running instances of our app aren’t taking traffic due to the latency of an upstream dependency if it has become slow. In some cases, if this doesn’t break the experience of the end-user, we could tolerate longer timeouts when doing checks.
2. Including upstream services in the probe checks
Some engineers suggest that we should not check the availability of upstream dependencies due to the potential for cascading failures to the entire system. Instead, we should try to rely more on mechanisms like retries with exponential backoff and circuit breakers implemented either at the app level (Resilience4j) or infrastructure level, for example in mesh (Istio, Linkerd2, Consul Connect).
3. Checks should be lightweight
If our microservice framework is either implemented or configured by us in such a way that the probe request to the readiness endpoint makes it send requests to its dependencies to report the status, then we should ensure that this check doesn’t take too long to avoid the risk of a probe timeout which is equal to reporting the error (see the paragraph on active vs passive checks later in this article).
4. Will reporting readiness failure actually help
If one of the app dependencies is experiencing a temporary latency increase due to network conditions or an increase in load it needs to process (before it scales out with Horizontal Pod Autoscaler), will reporting readiness failure help in recovering the upstream service? Can we rely on other infrastructure components to help with this, such as request throttling or rate-limiting at the ingress or mesh level?
For more information, check this excellent article by Colin Breck: https://blog.colinbreck.com/kubernetes-liveness-and-readiness-probes-how-to-avoid-shooting-yourself-in-the-foot/
Dependency failure without a probe
The readiness probe is one of the most useful new features of K8s and we were definitely missing it in Mesos — the previous container orchestration system used in HMH to run components of our e-learning platform.
Let’s quickly review the scenario of what may happen when the readiness probe isn’t configured.
This scenario is applicable in the following cases (that we have run into ourselves):
- an instance is unable to connect or reconnect to a DB
- an instance was unable to refresh temporary credentials before the token expired and now it is unable to authenticate to an upstream resource
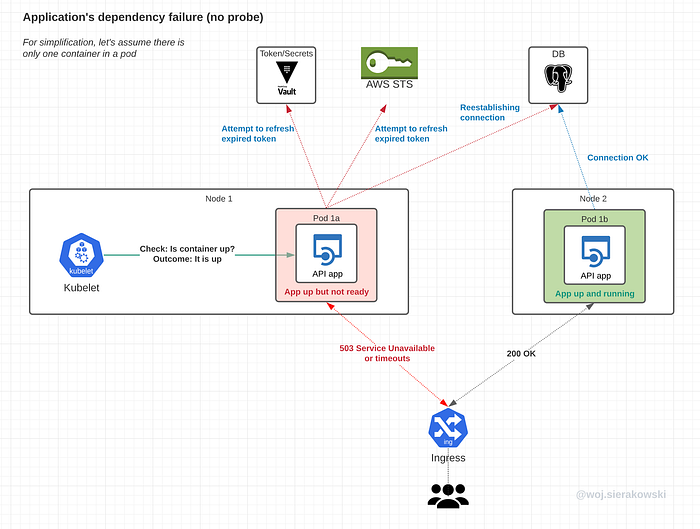
Consequences:
- the app is aware of the issue and it is attempting to remediate it, however, it isn’t indicating any issue back to K8s
- at the same time users seeing issues with saving their work will eagerly resubmit their requests which in effect will create a spike of requests and that certainly isn’t helping the service in solving its connection issues
- users’ requests are sent to the instance that isn’t ready, thus they will receive either response errors or timeouts
Dependency failure with a probe

With the readiness probe failing for one instance, K8s will update the service/mesh to stop sending traffic to it, giving it time to remediate without the need to handle any additional load at the same time.
This works fine if the failure can be solved by the application. But if it doesn’t have any mechanism to fix the root cause, like retrieving a set of valid tokens to reconnect to a DB, then we could end up with an instance hanging there infinitely. If the upstream problem is not automatically resolvable either by the app itself or the K8s, then this will require the operator’s manual intervention. This is when observability and alerting systems come in handy.
Dependency failure for all instances
When the upstream problem is common for all instances in our deployment and if readiness checks are failing for all of them, then the entire deployment will be disconnected from the clients.
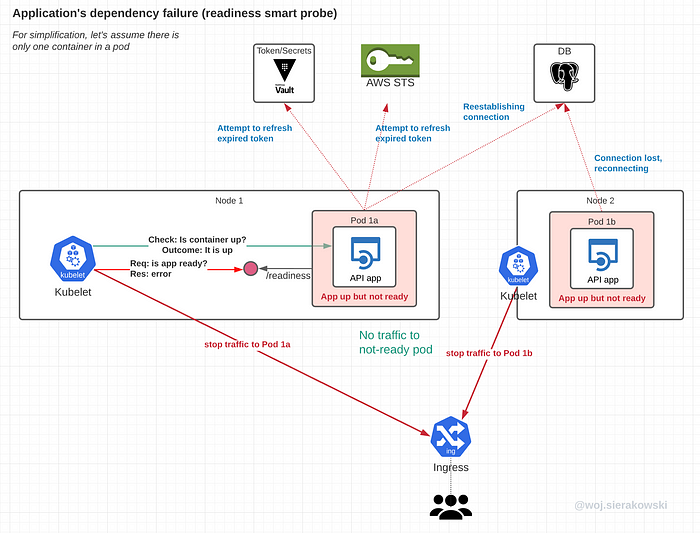
This is fine as there’s no point in sending users requests if they are going to fail anyway. The error response will come from the infrastructure layer like mesh or ingress and not the application, giving it a little break to “focus” on just one task — reestablishing broken connections.
Readiness pass or fail
Considering that a typical app has many dependencies that may fail for a variety of reasons, configuring the application framework to respond to so many potential issues in such a way that it would improve rather than impair its availability is a non-trivial task.
The diagram below presents a couple of suggestions to consider.
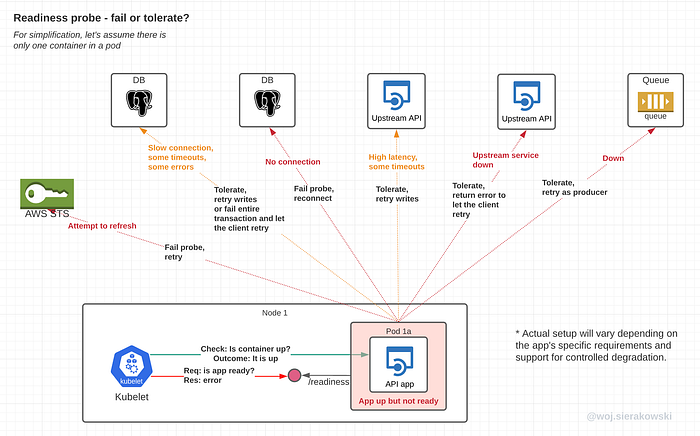
One common rule of thumb is to ask a question on whether the app needs a given resource to roll back a business transaction. If it does, it means that the upstream resource is critical to the business function and in this case a failure should be returned. If it doesn’t, the state of that resource will not be part of the readiness check reporting.
Active and Passive health checking
There are two common approaches to how the application framework can check its readiness (smart probe approach) and report it back to the kubelet in response.
Active checking
The active check approach is implemented in such a way that each probe’s request to the health endpoint invokes a series of requests to each dependency of the service. Those requests are synthetic, they have no business meaning and the only reason for their existence is to check that the dependency is accessible.
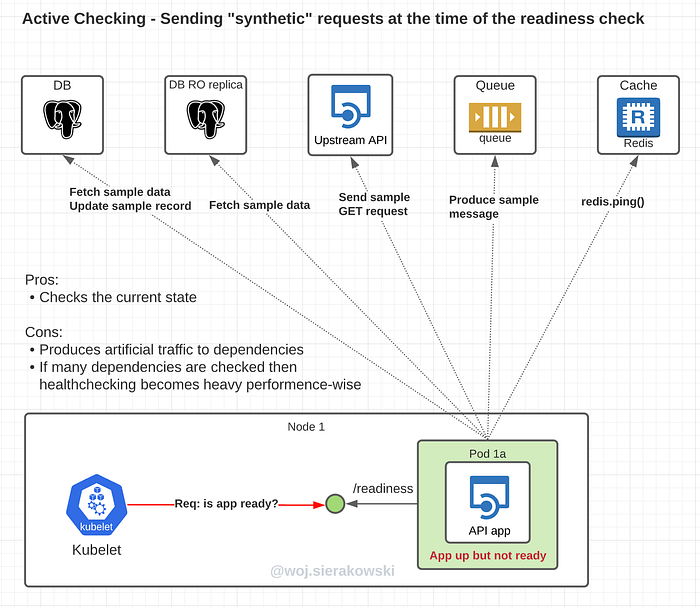
The pros of the active approach:
- Checks the current state
Cons:
- Produces artificial traffic to dependencies
- If a large number of dependencies is checked, the health checking becomes heavy performance-wise and might take a long time
Passive checking
The alternative and more popular approach is to implement a passive check where existing request flow is used and its results determine service readiness. The statistics for upstream connections are stored in memory and a current snapshot is used to determine a positive or negative response when a health probe request arrives.
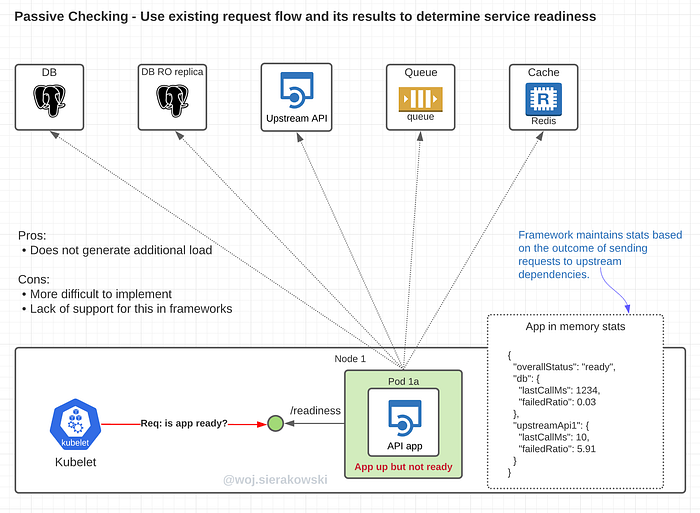
The pros of the passive approach:
- Doesn’t generate additional load
Cons:
- More difficult to implement
- Lack of built-in support in many frameworks
Healthchecks in microservice frameworks
Let’s have a quick look at what health check support looks like in two popular frameworks for popular programming stacks.
Healthchecks in Spring
When the actuator is added as a dependency to pom.xml:
<dependency>
    <groupId>org.springframework.boot</groupId>
    <artifactId>spring-boot-starter-actuator</artifactId>
</dependency>
then health checks can be enabled in application.properties files in the following way:
management.endpoint.health.probes.enabled=true
management.health.livenessState.enabled=true
management.health.readinessState.enabled=true
This will expose /actuator/health/liveness and /actuator/health/readiness endpoints as liveness and readiness probes.
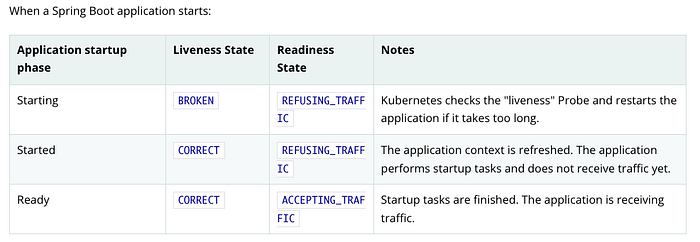
Springs comes with a built-in logic that will recognise when the application is ready. Here’s how readiness and liveness state changes according to application lifecycle events in Spring:
1. Register listeners and initializers
2. Prepare the Environment
3. Prepare the ApplicationContext
4. Load bean definitions
5. Change the liveness state to CORRECT (instead of BROKEN)
6. Call the application and command-line runners
7. Change the readiness state to ACCEPTING_TRAFFIC (instead of ACCEPTING_TRAFFIC)
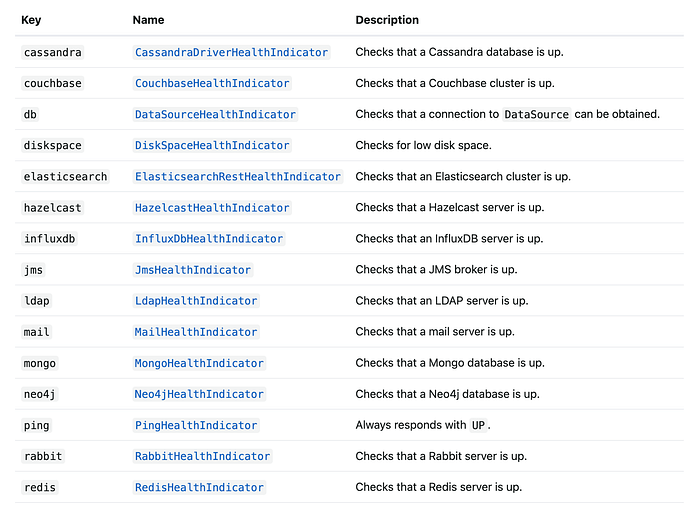
Spring comes with an auto-configured HealthIndicator for various dependencies that can be manually enabled or disabled with management.health.key.enabled depending on the needs (more info: auto-configured-health-indicators).
Liveness and readiness probes in Actuator are configured as Health Groups (a feature available since Spring Boot v2.2). This means that we can specify which health indicators, both built-in as well as custom, should be included in the given probe check by adding the following line to application.properties file (more details here: kuberenetes-probes.external-state):
management.endpoint.health.group.liveness.include=livenessstate,cacheCheckmanagement.endpoint.health.group.readiness.include=readinessState,customCheck
As an example (explained in detail in this easy to follow tutorial), if you use RabbitMQ in your project and decide it is critical to the business function of your application so that whenever there are issues with connecting to it the readiness check must fail, then you should add rabbit to the readiness health group.
When you have multiple indicators in a group and if any of those indicators fail, then the entire group fails. It may not be obvious which indicator actually caused the failure, but more details can be exposed with the following setting:
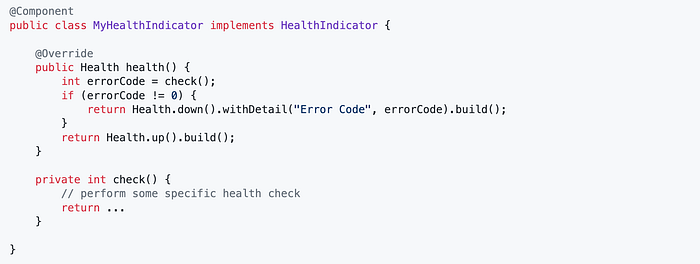
management.endpoint.health.show-details=alwaysYou can also write your own custom HealthIndicators by registering a bean implementing the HealthIndicator interface and returning the Health object with a status set either as up or down (as explained in more detail here: writing-custom-health-indicators).
When the application has started, the current health state can be changed by publishing AvailabilityChangeEvents from any component where this is required.
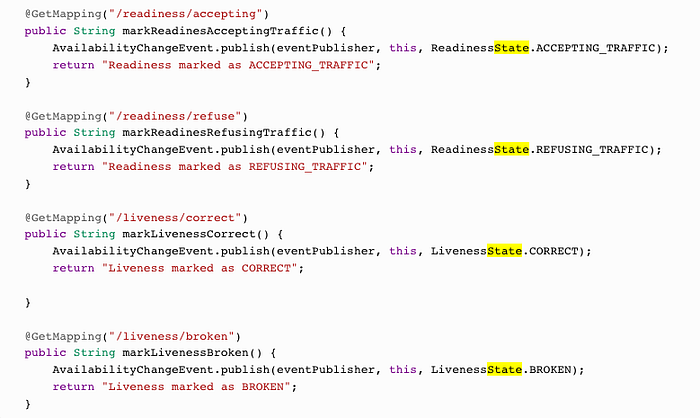
See the full example here: configuring-graceful-shutdown-readiness-and-liveness.
Healthchecks in Node.JS
In the Node.JS world, popular frameworks require the use of additional extensions or alternatively some custom work to enable health check endpoints.
Nest.js documentation provides the recipe for using GoDaddy’s Terminus to handle health checks: https://docs.nestjs.com/recipes/terminus
Express.js also provides decent documentation with guidelines for using 3rd party products: https://expressjs.com/en/advanced/healthcheck-graceful-shutdown.html
There is also a library by CloudNativeJS that could be integrated with your application. I used it in the demo app that we used in the first article of this series.
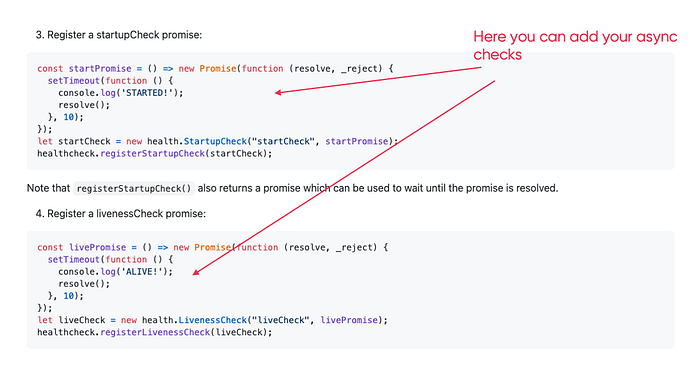
More info: https://github.com/CloudNativeJS/cloud-health/blob/master/README.md
Configuration Examples
Initial configuration example
We will now look at the example probe configuration and the thought process behind it.
Startup probe:
- I know my app’s boot time is around 10 secs with given CPU and memory resources allocated to the app container and it may take another few secs to establish connections so I set the initial delay to 10 secs and will continue probing every 5 seconds for 50 secs (10 times) so that the probe would fail no later than after a minute in the unhappy scenario.
- The liveness configuration at the application level will consider the following checks:
- Are temporary tokens obtained?
- Is application configuration retrieved from the remote config server
- Is the DB connection established? - The checklist will not include:
- Access to cache or Kafka; assumption is that if they are down, the app should continue providing user experience and attempt to restore the connection in the background
Readiness probe:
- Initiated immediately after the startup probe’s success
- A probe check is sent every 10 secs, if an issue arises, the probe will need to fail 2 times, which means that traffic will be stopped in less than 30 seconds in the worst-case scenario
- When reporting readiness, the application will check:
- the connection to DB - The checklist will not include:
- connections to upstream services, Kafka, cache as the app can provide minimum required user experience without them while trying to restore in the background
Liveness probe:
- Initiated immediately after the startup probe’s success
- A probe check is sent every 10 secs, if an issue arises, the probe will need to fail 2 times, which means the instance will be restarted in less than 30 seconds in the worst-case scenario
- When reporting liveness, the application will use the dumb probe approach, it will check nothing, it is enough if the application is able to return 200 OK to the probe request
The rule to follow when designing probes configuration: observe, modify, iterate!
Between pass and fail
When designing resilient distributed systems consisting of many microservices, we should recognize and be prepared for the degraded state, where the application isn’t functioning in its fully functional and non-functional capacity but at the same time, it is still able to provide limited experience to the user.

As an example, let’s consider a single microservice that relies on a database for reads and writes, but is also supported by a read replica and cache.
Case 1: The application is in a healthy state
The app sends back positive health check responses when:
- read-write to the DB cluster is possible
- cache is accessible
Case 2: The application is in a degraded state
The app still sends back positive health check responses when:
- the cache is not accessible as the app will be a bit slower as all requests need to go to the database, but it will function properly from the business perspective
- primary DB is down but the read replica is up — question: can the service work with queries only?
- DB is down but the cache is up — question: can the service work with cache only, only reads and possibly with limited data?
Case 3: The application is in an unhealthy state
The app sends back failure health check responses when:
- it is unable to establish the connection to critical entire DB cluster and can’t work with cache only
Final thoughts
If you’ve got this far reading through this and the previous article then you probably realised that setting up health checks is more of a process than a single action. If you are just starting and deploying your first microservices to K8s then it might take a few iterations until you fine-tune accurate probe settings values for your deployment manifest and find the balanced configuration to get your application correctly reporting its state through the health endpoints. And remember:
- There’s no silver bullet, each application is different and so is the way to define their healthiness. What we do will be also influenced and constrained by the entire system, as our decisions will have positive, neutral or negative consequences on other components of that system.
- Always prefer to crash the app instead of letting it run with unhandled exceptions, when the application crashes, it will make K8s restart it. If the application swallows exceptions and isn’t functioning properly, then it will end up hanging there.
Health checks are a very important aspect that will contribute to making the entire distributed application more resilient, but there are some other considerations to keep in mind:
1. Importance of observability
- Healthchecks aren’t enough, we need to rely on monitoring and alerting, tracking error rates, and recognising trends.
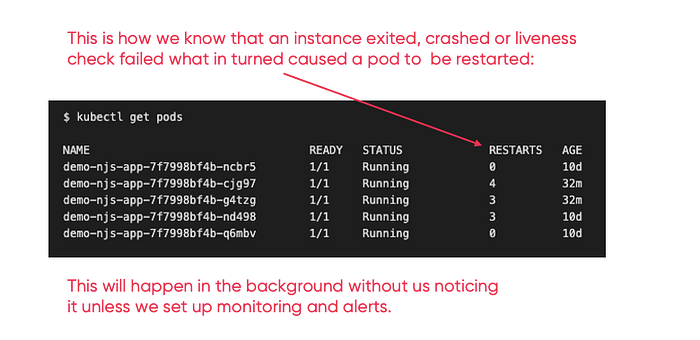
- Monitoring and reporting on the frequency of container restarts is an important operational metric.
- For logging and monitoring purposes configure your application’s health check endpoints to return different error codes along with additional information on the reason for failure.
- Deployments have many instances, restarts of some pods aren’t immediately apparent if the user doesn’t experience any issues. Set up alerts to stay aware of readiness failures and restarts due to liveness failures.
2. Exercise resilience of the entire system
- Let the Chaos Monkey wreak a bit of havoc in your cluster. Regularly restart pods to test startup dynamics and the knock-on effect on the system and its components. Recognize changes leading to negative behaviour before your platform’s users find out.
3. Support graceful shutdown
- Pods might be terminated for various reasons in addition to a failing probe, such as the rollout of a new app version, scaling in, cluster rebalancing, or node failure. Following the 9th factor “Disposability” of 12 Factor App principles, we should make sure that our app is aware of the initiated termination and shuts down in a controlled way allowing data to be successfully saved in the database, network and database connections to be closed successfully.
If you have your own experience with health checks, tips and stories you would like to share, don’t be shy and leave them in the comments.
If you liked this article and would like to see more on related or other topics then please let us know.
If you are interested in Kubernetes, then I highly recommend reading this piece by fellow HMH architect Kris Iyer: Spring Boot Configuration and Secret Management Patterns on Kubernetes.
Don’t forget to also check hmh.engineering for more interesting content from HMH engineers on various topics related to education, technology, accessibility and developer’s life.
I would like to thank Francislainy Campos, Kris Iyer and Brendan Donegan for reviewing this enormously long post!